程序员人生 网站导航

go profile

栏目:php教程时间:2016-10-04 12:09:58

go profile

简介

Go语言的性能分析工具pprof是Google C++ profiler的移植,非常有趣。

cpu profile

If the code used the Go testing package’s benchmarking support, we could use gotest’s standard -cpuprofile and -memprofile flags. In a standalone program like this one, we have to import runtime/pprof and add a few lines of code:

import "runtime/pprof" var cpuprofile = flag.String("cpuprofile", "", "write cpu profile to file") func main() { flag.Parse() if *cpuprofile != "" { f, err := os.Create(*cpuprofile) if err != nil { log.Fatal(err) } pprof.StartCPUProfile(f) defer pprof.StopCPUProfile() } ...

履行程序,同时指定-cpuprofile flag,生成profile文件,我们的go程序的binary是go_cpu_pro:

$ ./xtime ./go_cpu_pro -cpuprofile=cpu.prof Welcome to LoopTesterApp, Go edition Constructing Simple CFG... 15000 dummy loops Constructing CFG... Performing Loop Recognition 1 Iteration Another 50 iterations... .................................................. # of loops: 76001 (including 1 artificial root node) 61.42u 0.26s 36.75r 499900kB ./go_cpu_pro -cpuprofile=cpu.prof

运行go tool pprof解释生成的profile,同时进入pprof环境后,可以用help命令查看帮助信息,最经常使用的命令如top10,可以看最耗时的function:

$ go tool pprof go_cpu_pro cpu.prof Entering interactive mode (type "help" for commands) (pprof) top10 39.14s of 51.11s total (76.58%) Dropped 110 nodes (cum <= 0.26s) Showing top 10 nodes out of 66 (cum >= 1.20s) flat flat% sum% cum cum% 9.83s 19.23% 19.23% 20.55s 40.21% runtime.scanobject 6.32s 12.37% 31.60% 6.32s 12.37% runtime.heapBitsForObject 4.16s 8.14% 39.74% 26.88s 52.59% github.com/hundt98847/multi_lang_bench_go/havlakloopfinder.FindLoops 3.79s 7.42% 47.15% 10.88s 21.29% runtime.mallocgc 3.72s 7.28% 54.43% 4.08s 7.98% runtime.mapaccess1_fast64 3.62s 7.08% 61.51% 4.75s 9.29% runtime.greyobject 3.18s 6.22% 67.74% 8.02s 15.69% runtime.mapassign1 2.10s 4.11% 71.85% 2.16s 4.23% runtime.heapBitsSetType 1.22s 2.39% 74.23% 1.22s 2.39% runtime/internal/atomic.Or8 1.20s 2.35% 76.58% 1.20s 2.35% runtime.memclr

当CPU profiling开启时,Go程序每秒采样大约100次,1个采样由在当前正在履行的goroutine的堆栈上的程序计数器组成,这个profile有51.11*100=51110次采样,总时间是51.11s,在go tool pprof的输出中,每行是1个function,各列的含义顺次是:

  • 采样点落在该函数中的次数
  • 采样点落在该函数中的百分比
  • 上1项的积累百分比
  • 采样点落在该函数,和被它调用的函数中的总次数
  • 采样点落在该函数,和被它调用的函数中的总次数百分比
  • 函数名

To sort by the fourth and fifth columns, use the -cum (for cumulative) flag:

(pprof) top10 -cum 18.72s of 51.11s total (36.63%) Dropped 110 nodes (cum <= 0.26s) Showing top 10 nodes out of 66 (cum >= 9.21s) flat flat% sum% cum cum% 0 0% 0% 46.38s 90.75% runtime.goexit 0 0% 0% 27.31s 53.43% main.main 0 0% 0% 27.31s 53.43% runtime.main 0 0% 0% 26.88s 52.59% github.com/hundt98847/multi_lang_bench_go/havlakloopfinder.FindHavlakLoops 4.16s 8.14% 8.14% 26.88s 52.59% github.com/hundt98847/multi_lang_bench_go/havlakloopfinder.FindLoops 9.83s 19.23% 27.37% 20.55s 40.21% runtime.scanobject 0 0% 27.37% 18.59s 36.37% runtime.gcBgMarkWorker 0.52s 1.02% 28.39% 18.59s 36.37% runtime.gcDrain 3.79s 7.42% 35.81% 10.88s 21.29% runtime.mallocgc 0.42s 0.82% 36.63% 9.21s 18.02% runtime.newobject

我们还可使用web指令生成函数调用关系图,web命令会生成1个SVG格式的图片,我们需要预先安装graphviz,Ubuntu上我们可以用sudo apt-get install graphviz

(pprof) web

web

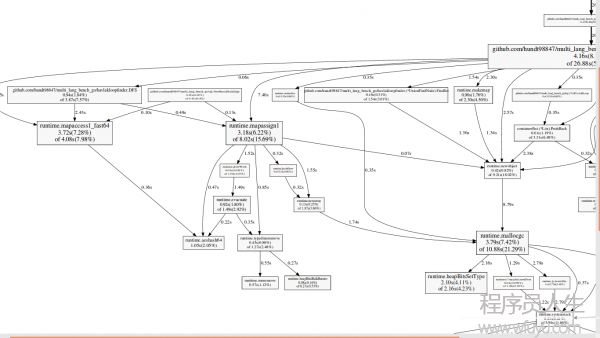
图片中,每一个box是1个function,并且依照该function运行的采样数改变box的尺寸,从X到Y的1条边代表着X calls Y,Edge上面的数字是这个调用出现在1个采样的次数。例如:runtime.mapaccess1_fast64 3.72s(7.28%) of 4.08s(7.98%),其中3.72s表示全部采样中,有3.72*100次runtime.mapaccess1_fast64正在运行,4.08s表示全部采样中,有4.08*100次堆栈中包括runtime.mapaccess1_fast64,runtime.mapaccess1_fast64到runtime.aeshash64那条边表示函数调用,上面的数字0.36s表示,全部采样中唯一0.36*100次采样捕捉到了runtime.mapaccess1_fast64对runtime.aeshash64的调用。

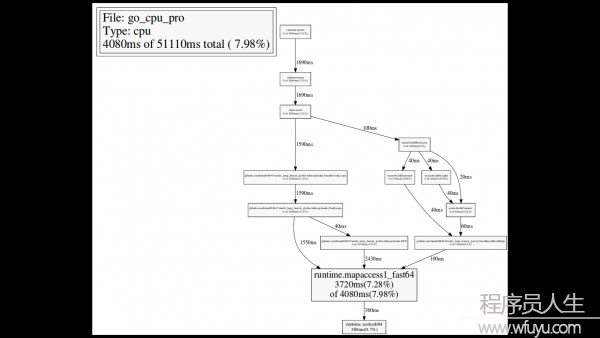
我们还可使用web指令,仅查看某个function的调用关系图,例如runtime.mapaccess1_fast64:
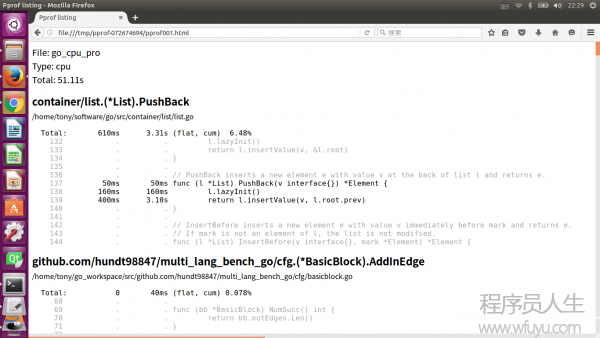
(pprof) web mapaccess1

web mapaccess1

查看函数内,每行代码的采样数:

(pprof) list DFS Total: 51.11s ROUTINE ======================== github.com/hundt98847/multi_lang_bench_go/havlakloopfinder.DFS in /home/tony/go_workspace/src/github.com/hundt98847/multi_lang_bench_go/havlakloopfinder/havlakloopfinder.go 940ms 7.68s (flat, cum) 15.03% of Total . . 155: return false . . 156:} . . 157: . . 158:// DFS - Depth-First-Search and node numbering. . . 159:// 10ms 10ms 160:func DFS(currentNode *cfg.BasicBlock, nodes []*UnionFindNode, number map[*cfg.BasicBlock]int, last []int, current int) int { 40ms 50ms 161: nodes[current].Init(currentNode, current) 40ms 530ms 162: number[currentNode] = current . . 163: . . 164: lastid := current 250ms 250ms 165: for ll := currentNode.OutEdges().Front(); ll != nil; ll = ll.Next() { 350ms 1.99s 166: if target := ll.Value.(*cfg.BasicBlock); number[target] == unvisited { 60ms 3.87s 167: lastid = DFS(target, nodes, number, last, lastid+1) . . 168: } . . 169: } 150ms 940ms 170: last[number[currentNode]] = lastid 40ms 40ms 171: return lastid . . 172:} . . 173: . . 174:// FindLoops . . 175:// . . 176:// Find loops and build loop forest using Havlak's algorithm, which

The listing shows the source code for the DFS function (really, for every function matching the regular expression DFS). The first three columns are the number of samples taken while running that line, the number of samples taken while running that line or in code called from that line, and the line number in the file. The related commanddisasmshows a disassembly of the function instead of a source listing; when there are enough samples this can help you see which instructions are expensive. Theweblistcommand mixes the two modes:it shows a source listing in which clicking a line shows the disassembly.

(pprof) weblist

weblist

some hints

Here are some hints with respect to how to interpret what you see in the profile.

If you see lots of time spent in runtime.mallocgc function, the program potentially makes excessive amount of small memory allocations. The profile will tell you where the allocations are coming from. See the memory profiler section for suggestions on how to optimize this case.

If lots of time is spent in channel operations, sync.Mutex code and other synchronization primitives or System component, the program probably suffers from contention. Consider to restructure program to eliminate frequently accessed shared resources. Common techniques for this include sharding/partitioning, local buffering/batching and copy-on-write technique.

If lots of time is spent in syscall.Read/Write, the program potentially makes excessive amount of small reads and writes. Bufio wrappers around os.File or net.Conn can help in this case.

If lots of time is spent in GC component, the program either allocates too many transient objects or heap size is very small so garbage collections happen too frequently. See Garbage Collector Tracer and Memory Profiler sections for optimization suggestions.

如果大量的时间消耗在runtime.mallocgc的函数,那末暗示程序产生了大量过度的小内存分配工作。查看内存分析器部份可以取得如何优化这类情况的建议。

如果大量的时间消耗在channel operations, sync.Mutex code and other synchronization primitives or System component,那末程序极可能正在饱受资源竞争的痛苦。

如果大量的时间消耗在syscall.Read/Write,那末暗示程序产生了大量过度的小块读写。对这类情况,Bufio会很有帮助。

如果大量的时间消耗在GC component,那末程序或分配了大量短暂的对象,或堆size太小了。

memory profile

与cpu profile相同,memory profile也需要导入runtime/pprof,同时增加1些代码:

import "runtime/pprof" var memprofile = flag.String("memprofile", "", "write memory profile to this file") ... FindHavlakLoops(cfgraph, lsgraph) if *memprofile != "" { f, err := os.Create(*memprofile) if err != nil { log.Fatal(err) } pprof.WriteHeapProfile(f) f.Close() return }

履行程序,同时指定-memprofile flag,生成profile文件,我们的go程序的binary是go_mem_pro:

$ ./xtime ./go_mem_pro -memprofile=mem.prof Welcome to LoopTesterApp, Go edition Constructing Simple CFG... 15000 dummy loops Constructing CFG... Performing Loop Recognition 1 Iteration 2.31u 0.12s 1.41r 263852kB ./go_mem_pro -memprofile=mem.prof

运行go tool pprof解释生成的profile,进入pprof环境:

$ go tool pprof go_mem_pro mem.prof Entering interactive mode (type "help" for commands) (pprof) top10 108.34MB of 108.34MB total ( 100%) Dropped 2 nodes (cum <= 0.54MB) Showing top 10 nodes out of 13 (cum >= 32MB) flat flat% sum% cum cum% 39.84MB 36.77% 36.77% 39.84MB 36.77% github.com/hundt98847/multi_lang_bench_go/havlakloopfinder.FindLoops 35.50MB 32.77% 69.54% 68.50MB 63.23% github.com/hundt98847/multi_lang_bench_go/cfg.NewBasicBlockEdge 33MB 30.46% 100% 33MB 30.46% container/list.(*List).PushBack 0 0% 100% 15MB 13.85% github.com/hundt98847/multi_lang_bench_go/cfg.(*BasicBlock).AddInEdge 0 0% 100% 18MB 16.62% github.com/hundt98847/multi_lang_bench_go/cfg.(*BasicBlock).AddOutEdge 0 0% 100% 39.84MB 36.77% github.com/hundt98847/multi_lang_bench_go/havlakloopfinder.FindHavlakLoops 0 0% 100% 67.50MB 62.31% main.buildBaseLoop 0 0% 100% 36.50MB 33.69% main.buildConnect 0 0% 100% 32MB 29.54% main.buildDiamond 0 0% 100% 32MB 29.54% main.buildStraight

现在这个采样是内存分配, not clock ticks. To find the memory allocations, we can list those functions.

(pprof) list FindLoops Total: 108.34MB ROUTINE ======================== github.com/hundt98847/multi_lang_bench_go/havlakloopfinder.FindLoops in /home/tony/go_workspace/src/github.com/hundt98847/multi_lang_bench_go/havlakloopfinder/havlakloopfinder.go 39.84MB 39.84MB (flat, cum) 36.77% of Total . . 183: return . . 184: } . . 185: . . 186: size := cfgraph.NumNodes() . . 187: 1.97MB 1.97MB 188: nonBackPreds := make([]map[int]bool, size) 11.54MB 11.54MB 189: backPreds := make([]list.List, size) . . 190: . . 191: number := make(map[*cfg.BasicBlock]int) 1.97MB 1.97MB 192: header := make([]int, size, size) 1.97MB 1.97MB 193: types := make([]int, size, size) 1.97MB 1.97MB 194: last := make([]int, size, size) 1.97MB 1.97MB 195: nodes := make([]*UnionFindNode, size, size) . . 196: . . 197: for i := 0; i < size; i++ { 11.50MB 11.50MB 198: nodes[i] = new(UnionFindNode) . . 199: } . . 200: . . 201: // Step a: . . 202: // - initialize all nodes as unvisited. . . 203: // - depth-first traversal and numbering. . . 204: // - unreached BB's are marked as dead. . . 205: // . . 206: for i, bb := range cfgraph.BasicBlocks() { 5.44MB 5.44MB 207: number[bb] = unvisited 1.50MB 1.50MB 208: nonBackPreds[i] = make(map[int]bool) . . 209: } . . 210: . . 211: DFS(cfgraph.StartBasicBlock(), nodes, number, last, 0) . . 212: . . 213: // Step b: . . 214: // - iterate over all nodes. . . 215: // . . 216: // A backedge comes from a descendant in the DFS tree, and non-backedges

顺便说1句, 假设我们运行go tool pprof与--inuse_objectsflag, it will report allocation counts instead of sizes:

$ go tool pprof --inuse_objects go_mem_pro mem.prof Entering interactive mode (type "help" for commands) (pprof) top10 1381266 of 1381266 total ( 100%) Dropped 2 nodes (cum <= 6906) Showing top 10 nodes out of 13 (cum >= 371389) flat flat% sum% cum cum% 720918 52.19% 52.19% 720918 52.19% container/list.(*List).PushBack 413266 29.92% 82.11% 413266 29.92% github.com/hundt98847/multi_lang_bench_go/havlakloopfinder.FindLoops 247082 17.89% 100% 968000 70.08% github.com/hundt98847/multi_lang_bench_go/cfg.NewBasicBlockEdge 0 0% 100% 327690 23.72% github.com/hundt98847/multi_lang_bench_go/cfg.(*BasicBlock).AddInEdge 0 0% 100% 393228 28.47% github.com/hundt98847/multi_lang_bench_go/cfg.(*BasicBlock).AddOutEdge 0 0% 100% 413266 29.92% github.com/hundt98847/multi_lang_bench_go/havlakloopfinder.FindHavlakLoops 0 0% 100% 946154 68.50% main.buildBaseLoop 0 0% 100% 469696 34.00% main.buildConnect 0 0% 100% 498304 36.08% main.buildDiamond 0 0% 100% 371389 26.89% main.buildStraight

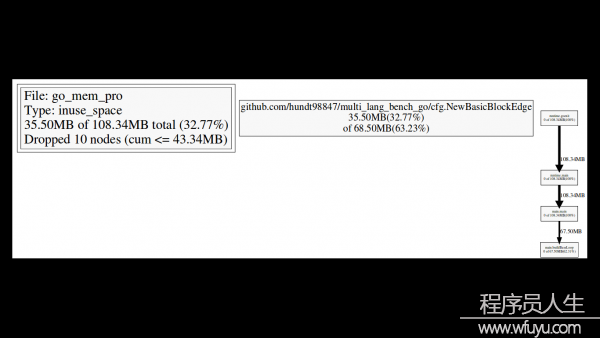
还有,我们可使用–nodefraction=0.1 告知go tool pprof忽视掉低于10%的采样的box,固然数字我们是可以改的,下面是2次修改nodefraction的对照:

$ go tool pprof --nodefraction=0.1 go_mem_pro mem.prof Entering interactive mode (type "help" for commands) (pprof) web

nodefraction0.1

$ go tool pprof --nodefraction=0.4 go_mem_pro mem.prof Entering interactive mode (type "help" for commands) (pprof) web

nodefraction0.4

heap profile

package main import ( "fmt" "os" "runtime/pprof" ) func main() { fmt.Println("--lookup heap---------------") p4heap := pprof.Lookup("heap") p4heap.WriteTo(os.Stdout, 1) }
heap profile: 4: 266528 [123: 11284472] @ heap/1048576 1: 262144 [4: 376832] @ 0x28d9f 0x2a201 0x2a28a 0x2624d 0x26188 0x94ca3 0x94a0b 0x17add6 0x17ae9f 0x1069d3 0xfe911 0xf0a3e 0xf0d22 0x21a70 # 0x2a201 cnew+0xc1 runtime/malloc.goc:718 # 0x2a28a runtime.cnewarray+0x3a runtime/malloc.goc:731 # 0x2624d makeslice1+0x4d runtime/slice.c:57 # 0x26188 runtime.makeslice+0x98 runtime/slice.c:38 # 0x94ca3 bytes.makeSlice+0x63 bytes/buffer.go:191 # 0x94a0b bytes.(*Buffer).ReadFrom+0xcb bytes/buffer.go:163 # 0x17add6 io/ioutil.readAll+0x156 io/ioutil/ioutil.go:32 # 0x17ae9f io/ioutil.ReadAll+0x3f io/ioutil/ioutil.go:41 # 0x1069d3 godoc/vfs.ReadFile+0x133 godoc/vfs/vfs.go:44 # 0xfe911 godoc.func·023+0x471 godoc/meta.go:80 # 0xf0a3e godoc.(*Corpus).updateMetadata+0x9e godoc/meta.go:101 # 0xf0d22 godoc.(*Corpus).refreshMetadataLoop+0x42 godoc/meta.go:141 2: 4096 [2: 4096] @ 0x28d9f 0x29059 0x1d252 0x1d450 0x106993 0xf1225 0xe1489 0xfbcad 0x21a70 # 0x1d252 newdefer+0x112 runtime/panic.c:49 # 0x1d450 runtime.deferproc+0x10 runtime/panic.c:132 # 0x106993 godoc/vfs.ReadFile+0xf3 godoc/vfs/vfs.go:43 # 0xf1225 godoc.(*Corpus).parseFile+0x75 godoc/parser.go:20 # 0xe1489 godoc.(*treeBuilder).newDirTree+0x8e9 godoc/dirtrees.go:108 # 0xfbcad godoc.func·002+0x15d godoc/dirtrees.go:100

The numbers in the beginning of each entry (“1: 262144 [4: 376832]”) represent number of currently live objects, amount of memory occupied by live objects, total number of allocations and amount of memory occupied by all allocations, respectively.

每一个条目开头的数字(”1: 262144 [4: 376832]”)分别表示目前存活的对象,存活对象占据的内存, 分配对象的个数和所有分配对象占据的内存总量。

block profile

package main import ( "fmt" "os" "runtime/pprof" ) func main() { fmt.Println("--lookup block--------------") p4block := pprof.Lookup("block") p4block.WriteTo(os.Stdout, 1) }

Note that not all blocking is bad. When a goroutine blocks, the underlying worker thread simply switches to another goroutine. So blocking in the cooperative Go environment is very different from blocking on a mutex in a non-cooperative systems (e.g. typical C++ or Java threading libraries, where blocking leads to thread idling and expensive thread context switches). To give you some feeling, let’s consider some examples.

Blocking on a time.Ticker is usually OK. If a goroutine blocks on a Ticker for 10 seconds, you will see 10 seconds of blocking in the profile, which is perfectly fine. Blocking on sync.WaitGroup is frequently OK. For example, is a task takes 10 seconds, the goroutine waiting on a WaitGroup for completion will account for 10 seconds of blocking in the profile. Blocking on sync.Cond may or may not be OK, depending on the situation. Consumer blocking on a channel suggests slow producers or lack of work. Producer blocking on a channel suggests that consumers are slower, but this is frequently OK. Blocking on a channel-based semaphore shows how much goroutines are gated on the semaphore. Blocking on a sync.Mutex or sync.RWMutex is usually bad.

并不是所有的阻塞都是不利的。当1个goroutine阻塞时,底层的工作线程就会简单地转换到另外一个goroutine。所以Go并行环境下的阻塞与非并行环境下的mutex的阻塞是有很大不同的(例如典型的C++或Java线程库,当产生阻塞时会引发线程空载和高昂的线程切换)。几个例子:

在time.Ticker上产生的阻塞通常是可行的,如果1个goroutine阻塞Ticker超过10秒,你将会在profile中看到有10秒的阻塞,这是很好的。产生在sync.WaitGroup上的阻塞常常也是可以的,例如,1个任务需要10秒,等待WaitGroup完成的goroutine会在profile中生成10秒的阻塞。产生在sync.Cond上的阻塞可好可坏,取决于情况不同。消费者在通道阻塞表明生产者缓慢或不工作。生产者在通道阻塞,表明消费者缓慢,但这通常也是可以的。在基于channel-based semaphore产生阻塞,表明了限制在这个信号量上的goroutine的数量。产生在sync.Mutex或sync.RWMutex上的阻塞通常是不利的。你可以在可视化进程中,在pprof中使用–ignore标志来从profile中排除已知的无关阻塞。

goroutinue profile

goroutine profile: total 10003 10000 @ 0x42ca8a 0x42cb7e 0x40569f 0x4053b5 0x401042 0x45b001

The goroutine profiler simply gives you current stacks of all live goroutines in the process. It can be handy to debug load balancing issues (see Scheduler Trace section below), or to debug deadlocks. The profile makes sense only for a running app, so go test does not expose it.

Note that goroutines in “syscall” state consume an OS thread, other goroutines do not (except for goroutines that called runtime.LockOSThread, which is, unfortunately, not visible in the profile). Note that goroutines in “IO wait” state also do not consume threads, they are parked on non-blocking network poller (which uses epoll/kqueue/GetQueuedCompletionStatus to unpark goroutines later).

goroutinue分析器简单地提供给你当前进程中所有活跃的Go协程堆栈。它可以方便地调试负载平衡问题(参考下面的调度器追踪章节),或调试死锁。这个配置仅仅对运行的程序成心义,所以go test是没用的。

syscall状态的goroutinue将会消耗1个OS线程,而其他的Go协程则不会(除调用runtime.LockOSThreadd的goroutinue,不幸的是,它在profile中是不可见的)。一样需要注意的是在IO wait状态的goroutinue一样不会消耗线程,他们停驻在非阻塞的网络轮询器(通常稍后使用epoll/kqueue/GetQueuedCompletionStatus来唤醒goroutines)。

Garbage Collector Trace

$ GODEBUG=gctrace=1 ./myserver

Then the program will print output similar to the following during execution:

gc9(2): 12+1+744+8 us, 2 -> 10 MB, 108615 (593983⑷85368) objects, 4825/3620/0 sweeps, 0(0) handoff, 6(91) steal, 16/1/0 yields gc10(2): 12+6769+767+3 us, 1 -> 1 MB, 4222 (593983⑸89761) objects, 4825/0/1898 sweeps, 0(0) handoff, 6(93) steal, 16/10/2 yields gc11(2): 799+3+2050+3 us, 1 -> 69 MB, 831819 (1484009⑹52190) objects, 4825/691/0 sweeps, 0(0) handoff, 5(105) steal, 16/1/0 yields

Let’s consider the meaning of these numbers. One line per GC is printed. The first number (“gc9”) is the number of GC (this is the 9-th GC since program start). The number in parens (“(2)”) is the number of worker threads participated in the GC. The next 4 numbers (“12+1+744+8 us”) mean stop-the-world, sweeping, marking and waiting for worker threads to finish, in microseconds, respectively. The next 2 numbers (“2 -> 10 MB”) mean size of live heap after the previous GC and full heap size (including garbage) before the current GC. The next 3 numbers (“108615 (593983⑷85368) objects”) are total number of objects in heap (including garbage) and total number of memory allocation and free operations. The next 3 numbers (“4825/3620/0 sweeps”) characterize sweep phase (of the previous GC): there were total 4825 memory spans, 3620 were swept on demand or in background, 0 were swept during stop-the-world phase (the rest were unused spans). The next 4 numbers (“0(0) handoff, 6(91) steal”) characterize load balancing during parallel mark phase: there were 0 object handoff operations (0 objects were handoff), and 6 steal operations (91 objects were stolen). The last 3 numbers (“16/1/0 yields”) characterize effectiveness of parallel mark phase: there were total of 17 yield operations during waiting for another thread.

每次GC输出1行。

  • 第1个数字(”gc9”)是GC的编号(这是从程序开始后的第9个GC),在括号中的数字(”(2)”)是参与GC的工作线程的数量。
  • 随后的4个数字(”12+1+744+8 us”)分别是工作线程完成GC的stop-the-world, sweeping, marking和waiting时间,单位是微秒。
  • 接下来的两个数字(”2 -> 10 MB”)表示前1个GC过后的活跃堆大小和当前GC开始前全部的堆(包括垃圾)的大小。
  • 再接下来的3个数字 (”108615 (593983⑷85368) objects”)是堆中的对象总数(包括垃圾)和分配操作的内存总数和释放操作的内存总数。
  • 后面的3个数字(”4825/3620/0 sweeps”)表示sweep phase (of the previous GC):总共有4825个memory spans,3620立即或在后台清除,0个在stop-the-world阶段清除(剩余的是没有使用的spans)。
  • 再后面的4个数字(”0(0) handoff, 6(91) steal”)表示了load balancing during parallel mark phase:there were 0 object handoff operations (0 objects were handoff), and 6 steal operations (91 objects were stolen).
  • 最后的3个数字(”16/1/0 yields”)表示了effectiveness of parallel mark phase:there were total of 17 yield operations during waiting for another thread.

Memory Allocator Trace

内存分配器跟踪只是简单地将所有的内存分配和释放操作转储到控制台。通过设置环境变量GODEBUG=allocfreetrace=1就能够开启该功能。输出看起来像下面的内容:

tracealloc(0xc208062500, 0x100, array of parse.Node) goroutine 16 [running]: runtime.mallocgc(0x100, 0x3eb7c1, 0x0) runtime/malloc.goc:190 +0x145 fp=0xc2080b39f8 runtime.growslice(0x31f840, 0xc208060700, 0x8, 0x8, 0x1, 0x0, 0x0, 0x0) runtime/slice.goc:76 +0xbb fp=0xc2080b3a90 text/template/parse.(*Tree).parse(0xc2080820e0, 0xc208023620, 0x0, 0x0) text/template/parse/parse.go:289 +0x549 fp=0xc2080b3c50 ... tracefree(0xc208002d80, 0x120) goroutine 16 [running]: runtime.MSpan_Sweep(0x73b080) runtime/mgc0.c:1880 +0x514 fp=0xc20804b8f0 runtime.MCentral_CacheSpan(0x69c858) runtime/mcentral.c:48 +0x2b5 fp=0xc20804b920 runtime.MCache_Refill(0x737000, 0xc200000012) runtime/mcache.c:78 +0x119 fp=0xc20804b950 ...

The trace contains address of the memory block, size, type, goroutine id and the stack trace.

Scheduler Trace

调度器追踪可以提供对 goroutine 调度的动态行动的内视,并且可以用来调试负载平衡和可扩大性问题。要启用调度器追踪,可以带有环境变量 GODEBUG=schedtrace=1000来运行程序(这个值的意思是输出的周期,单位是ms,这类情况下是每秒1次):

SCHED 1004ms: gomaxprocs=4 idleprocs=0 threads=11 idlethreads=4 runqueue=8 [0 1 0 3] SCHED 2005ms: gomaxprocs=4 idleprocs=0 threads=11 idlethreads=5 runqueue=6 [1 5 4 0] SCHED 3008ms: gomaxprocs=4 idleprocs=0 threads=11 idlethreads=4 runqueue=10 [2 2 2 1]

The first number (“1004ms”) is time since program start. Gomaxprocs is the current value of GOMAXPROCS. Idleprocs is the number of idling processors (the rest are executing Go code). Threads is the total number of worker threads created by the scheduler (threads can be in 3 states: execute Go code (gomaxprocs-idleprocs), execute syscalls/cgocalls or idle). Idlethreads is the number of idling worker threads. Runqueue is the length of global queue with runnable goroutines. The numbers in square brackets (“[0 1 0 3]”) are lengths of per-processor queues with runnable goroutines. Sum of lengths of global and local queues represents the total number of goroutines available for execution.

  • 第1个数字(”1004ms”)是从程序开始后的时间。
  • Gomaxprocs 是当前的 GOMAXPROCS 值。
  • Idleprocs 是空闲的处理器数(剩下的在履行 Go 代码)。
  • Threads 是调度器产生的worker线程总数(线程有3种状态:履行 Go 代码(gomaxprocs-idleprocs),履行 syscalls/cgocalls,闲置)。
  • Idlethreads是闲置的worker线程数。
  • Runqueue 是可运行的 goroutine 的全局队列长度。方括号中的数字(”[0 1 0 3]”)是每一个processor的可运行的 goroutine 的队列的长度。全局和局部队列的长度总和表示可履行的 goroutine 的总数。

当1个程序不与 GOMAXPROCS 成线性比例和(或)没有消耗100%的CPU时间(top 命令),Scheduler Trace就显得非常有用。

理想的情况是:所有的处理器都在繁忙地运行 Go 代码,线程数公道,所有队列都有充足的任务且任务是公道均匀的散布的:

gomaxprocs=8 idleprocs=0 threads=40 idlethreads=5 runqueue=10 [20 20 20 20 20 20 20 20]

不好的情况是上面所列的东西并没有完全到达。例以下面这个演示,没有足够的任务来保持所有的处理器繁忙:

gomaxprocs=8 idleprocs=6 threads=40 idlethreads=30 runqueue=0 [0 2 0 0 0 1 0 0]

你可使用 goroutine profile来了解哪些goroutine块处于任务短缺状态。注意,只要所有的处理器处于忙绿状态,负载失衡就不是最坏的,它只会致使适度的load balance开消。

Memory Statistics

Go runtime exposes coarse-grained memory statistics viaruntime.ReadMemStatsfunction. The statistics are also exposed vianet/http/pprofat the bottom ofhttp://myserver:6060/debug/pprof/heap?debug=1. The statistics are described here.

# runtime.MemStats # Alloc = 92936 # TotalAlloc = 92936 # Sys = 1740800 # Lookups = 3 # Mallocs = 247 # Frees = 11 # HeapAlloc = 92936 # HeapSys = 753664 # HeapIdle = 401408 # HeapInuse = 352256 # HeapReleased = 0 # HeapObjects = 236 # Stack = 294912 / 294912 # MSpan = 7040 / 16384 # MCache = 4800 / 16384 # BuckHashSys = 2074 # NextGC = 4194304 # PauseNs = [0 0 0 0 0 0 0 0 0 0 0 0 0 0 0 0 0 0 0 0 0 0 0 0 0 0 0 0 0 0 0 0 0 0 0 0 0 0 0 0 0 0 0 0 0 0 0 0 0 0 0 0 0 0 0 0 0 0 0 0 0 0 0 0 0 0 0 0 0 0 0 0 0 0 0 0 0 0 0 0 0 0 0 0 0 0 0 0 0 0 0 0 0 0 0 0 0 0 0 0 0 0 0 0 0 0 0 0 0 0 0 0 0 0 0 0 0 0 0 0 0 0 0 0 0 0 0 0 0 0 0 0 0 0 0 0 0 0 0 0 0 0 0 0 0 0 0 0 0 0 0 0 0 0 0 0 0 0 0 0 0 0 0 0 0 0 0 0 0 0 0 0 0 0 0 0 0 0 0 0 0 0 0 0 0 0 0 0 0 0 0 0 0 0 0 0 0 0 0 0 0 0 0 0 0 0 0 0 0 0 0 0 0 0 0 0 0 0 0 0 0 0 0 0 0 0 0 0 0 0 0 0 0 0 0 0 0 0 0 0 0 0 0 0 0 0 0 0 0 0 0 0 0 0 0 0] # NumGC = 0 # DebugGC = false

Some of the interesting fields are:

  • HeapAlloc - current heap size.
  • HeapSys - total heap size.
  • HeapObjects - total number of objects in the heap.
  • HeapReleased - amount of memory released to the OS; runtime releases to the OS memory unused for 5 minutes, you can force this process withruntime/debug.FreeOSMemory.
  • Sys - total amount of memory allocated from OS.
  • Sys-HeapReleased - effective memory consumption of the program.
  • StackSys - memory consumed for goroutine stacks (note that some stacks are allocated from heap and are not accounted here, unfortunately there is no way to get total size of stacks (https://code.google.com/p/go/issues/detail?id=7468)).
  • MSpanSys/MCacheSys/BuckHashSys/GCSys/OtherSys - amount of memory allocated by runtime for various auxiliary purposes; they are generally not interesting, unless they are too high.
  • PauseNs - durations of last garbage collections.

profile使用方式汇总

httpServer pprof

如果你的go程序是用http包启动的web服务器,你想查看自己的web服务器的状态。这个时候就能够选择net/http/pprof。你只需要引入包_ “net/http/pprof”,然后就能够在阅读器中使用http://localhost:port/debug/pprof/直接看到当前web服务的状态,包括CPU占用情况和内存使用情况等。

package main import _ "net/http/pprof" import "net/http" import "fmt" var c chan struct{} = make(chan struct{}) func f() { <-c } func main() { // 1W个goroutine for i := 0; i < 10000; i++ { go f() } fmt.Println("Start httpServer at http://localhost:6060") http.ListenAndServe(":6060", nil) }

Use the pprof tool to look at the heap profile:

$ go tool pprof http://localhost:6060/debug/pprof/heap

Or to look at a 30-second CPU profile:

$ go tool pprof http://localhost:6060/debug/pprof/profile

Or to look at the goroutine blocking profile, after callingruntime.SetBlockProfileRatein your program:

$ go tool pprof http://localhost:6060/debug/pprof/block

Or to collect a 5-second execution trace:

$ wget http://localhost:6060/debug/pprof/trace?seconds=5

To view all available profiles, open http://localhost:6060/debug/pprof/ in your browser.

service pprof

如果你的go程序不是web服务器,而是1个服务进程,那末我们可以将profile信息输出到阅读器或文件。

package main import ( "fmt" "net/http" "runtime/pprof" ) var c chan struct{} = make(chan struct{}) func f() { <-c } func handler(w http.ResponseWriter, r *http.Request) { w.Header().Set("Content-Type", "text/plain") p := pprof.Lookup("goroutine") p.WriteTo(w, 1) } func main() { for i := 0; i < 10000; i++ { go f() } http.HandleFunc("/", handler) fmt.Println("Start httpServer at http://localhost:6060") http.ListenAndServe(":6060", nil) }

访问http://localhost:11181/,我们就能够得到全部goroutine的信息。也能够将profile信息写入文件或标准输出:

package main import ( "fmt" "os" "runtime/pprof" ) func main() { fmt.Println("--lookup heap---------------") p4heap := pprof.Lookup("heap") p4heap.WriteTo(os.Stdout, 1) fmt.Println("--lookup threadcreate-------") p4thread := pprof.Lookup("threadcreate") p4thread.WriteTo(os.Stdout, 1) fmt.Println("--lookup block--------------") p4block := pprof.Lookup("block") p4block.WriteTo(os.Stdout, 1) }

go test

go test内建了多个flag,用于输出profile:

$ go help testflag The following flags are recognized by the 'go test' command and control the execution of any</
------分隔线----------------------------

最新技术推荐